
June 2026
Without all of the Data Center activity, Amarillo's economy would be in the middle of a slowdown due to job losses.
After Tyson dropped an entire shift, 1700 workers, we are also seeing losses in manufacturing and health care at 2 of Amarillo's most important employers.
Amarillo workers employed for May is down 223 from last year, while total Panhandle is up 750 (meaning 973 more working outside Amarillo - primarily data center construction). The unemployment rate jumped .4% to 3.5% (primarily Tyson). Panhandle wages are 8%; Amarillo 4%.
The Household Survey shows a decrease of 200 jobs from last year, and the Employers Survey shows a loss of 260 jobs.
Retail Sales are up 18% from 12 months ago. Year-to-Date Sales are up 11%. New Car Sales are down 4% from last June. Used Car Sales are down 1%.
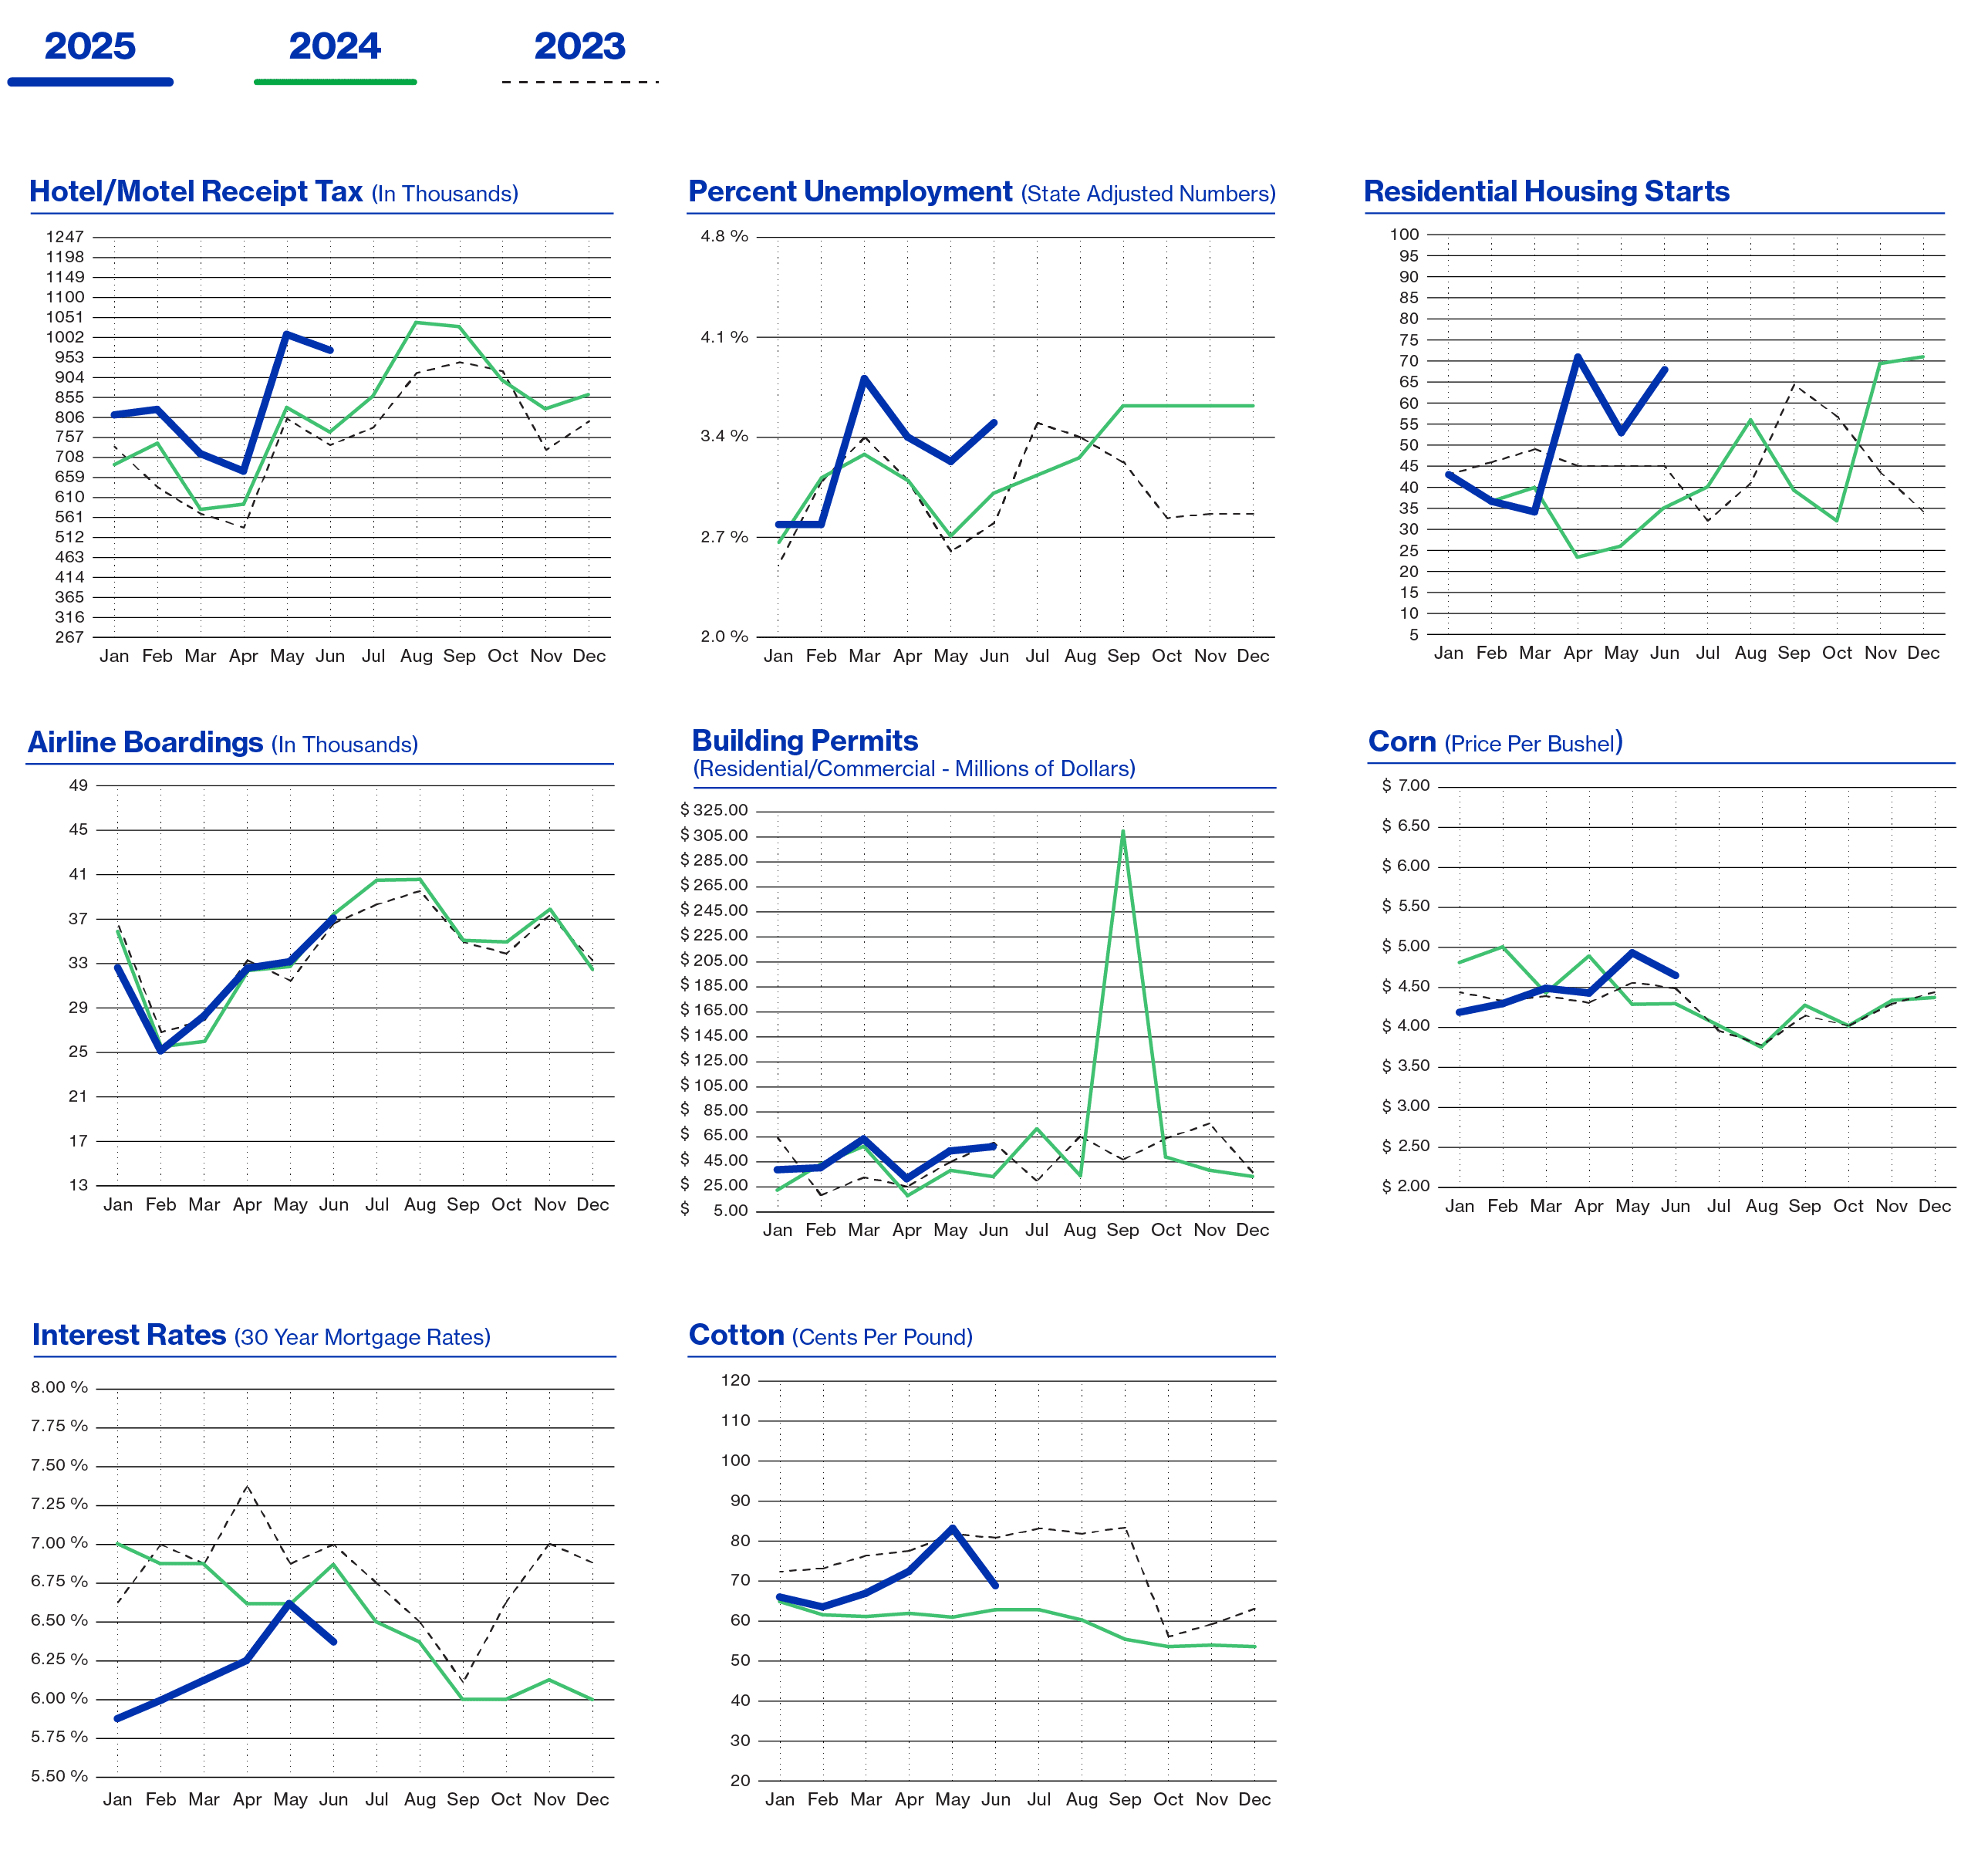
Motel bed tax receipts are up 27% for the month, but down from last month (AirBnbs are filled by data center workers, so regular motel bookings and room rates are up).
Airline boardings are down slightly, as United Airlines dropped one flight daily.
Housing in Amarillo is better, with prices up 4%, and 30-Year Mortgage Rates down 50 basis points from a year ago. There were 34 more starts this month than a year ago-up 94%. Year to Date Starts are up 63%. Building Permits are up 118% from 12 months ago. Year to Date Building Permits are up 47% from 2025.
There are 3 active drilling rigs in the Panhandle where there were none last year. Oil Prices are still over $75, and Natural Gas prices are down 22%.
Recent rains might help save corn this year. Prices are at $4.66, up 6% from a year ago. Wheat is down 7%, and this was one of the worst years ever for the crop.
Milk Prices are down 14% to $15.98, but area dairies are profitable due to cattle sales. Cattle continue to gain, as demand is steady and the herd isn't growing. Cattle Prices are up 14% from last June and are making over $200 per head out of the Feedyard.
Economic Pulse
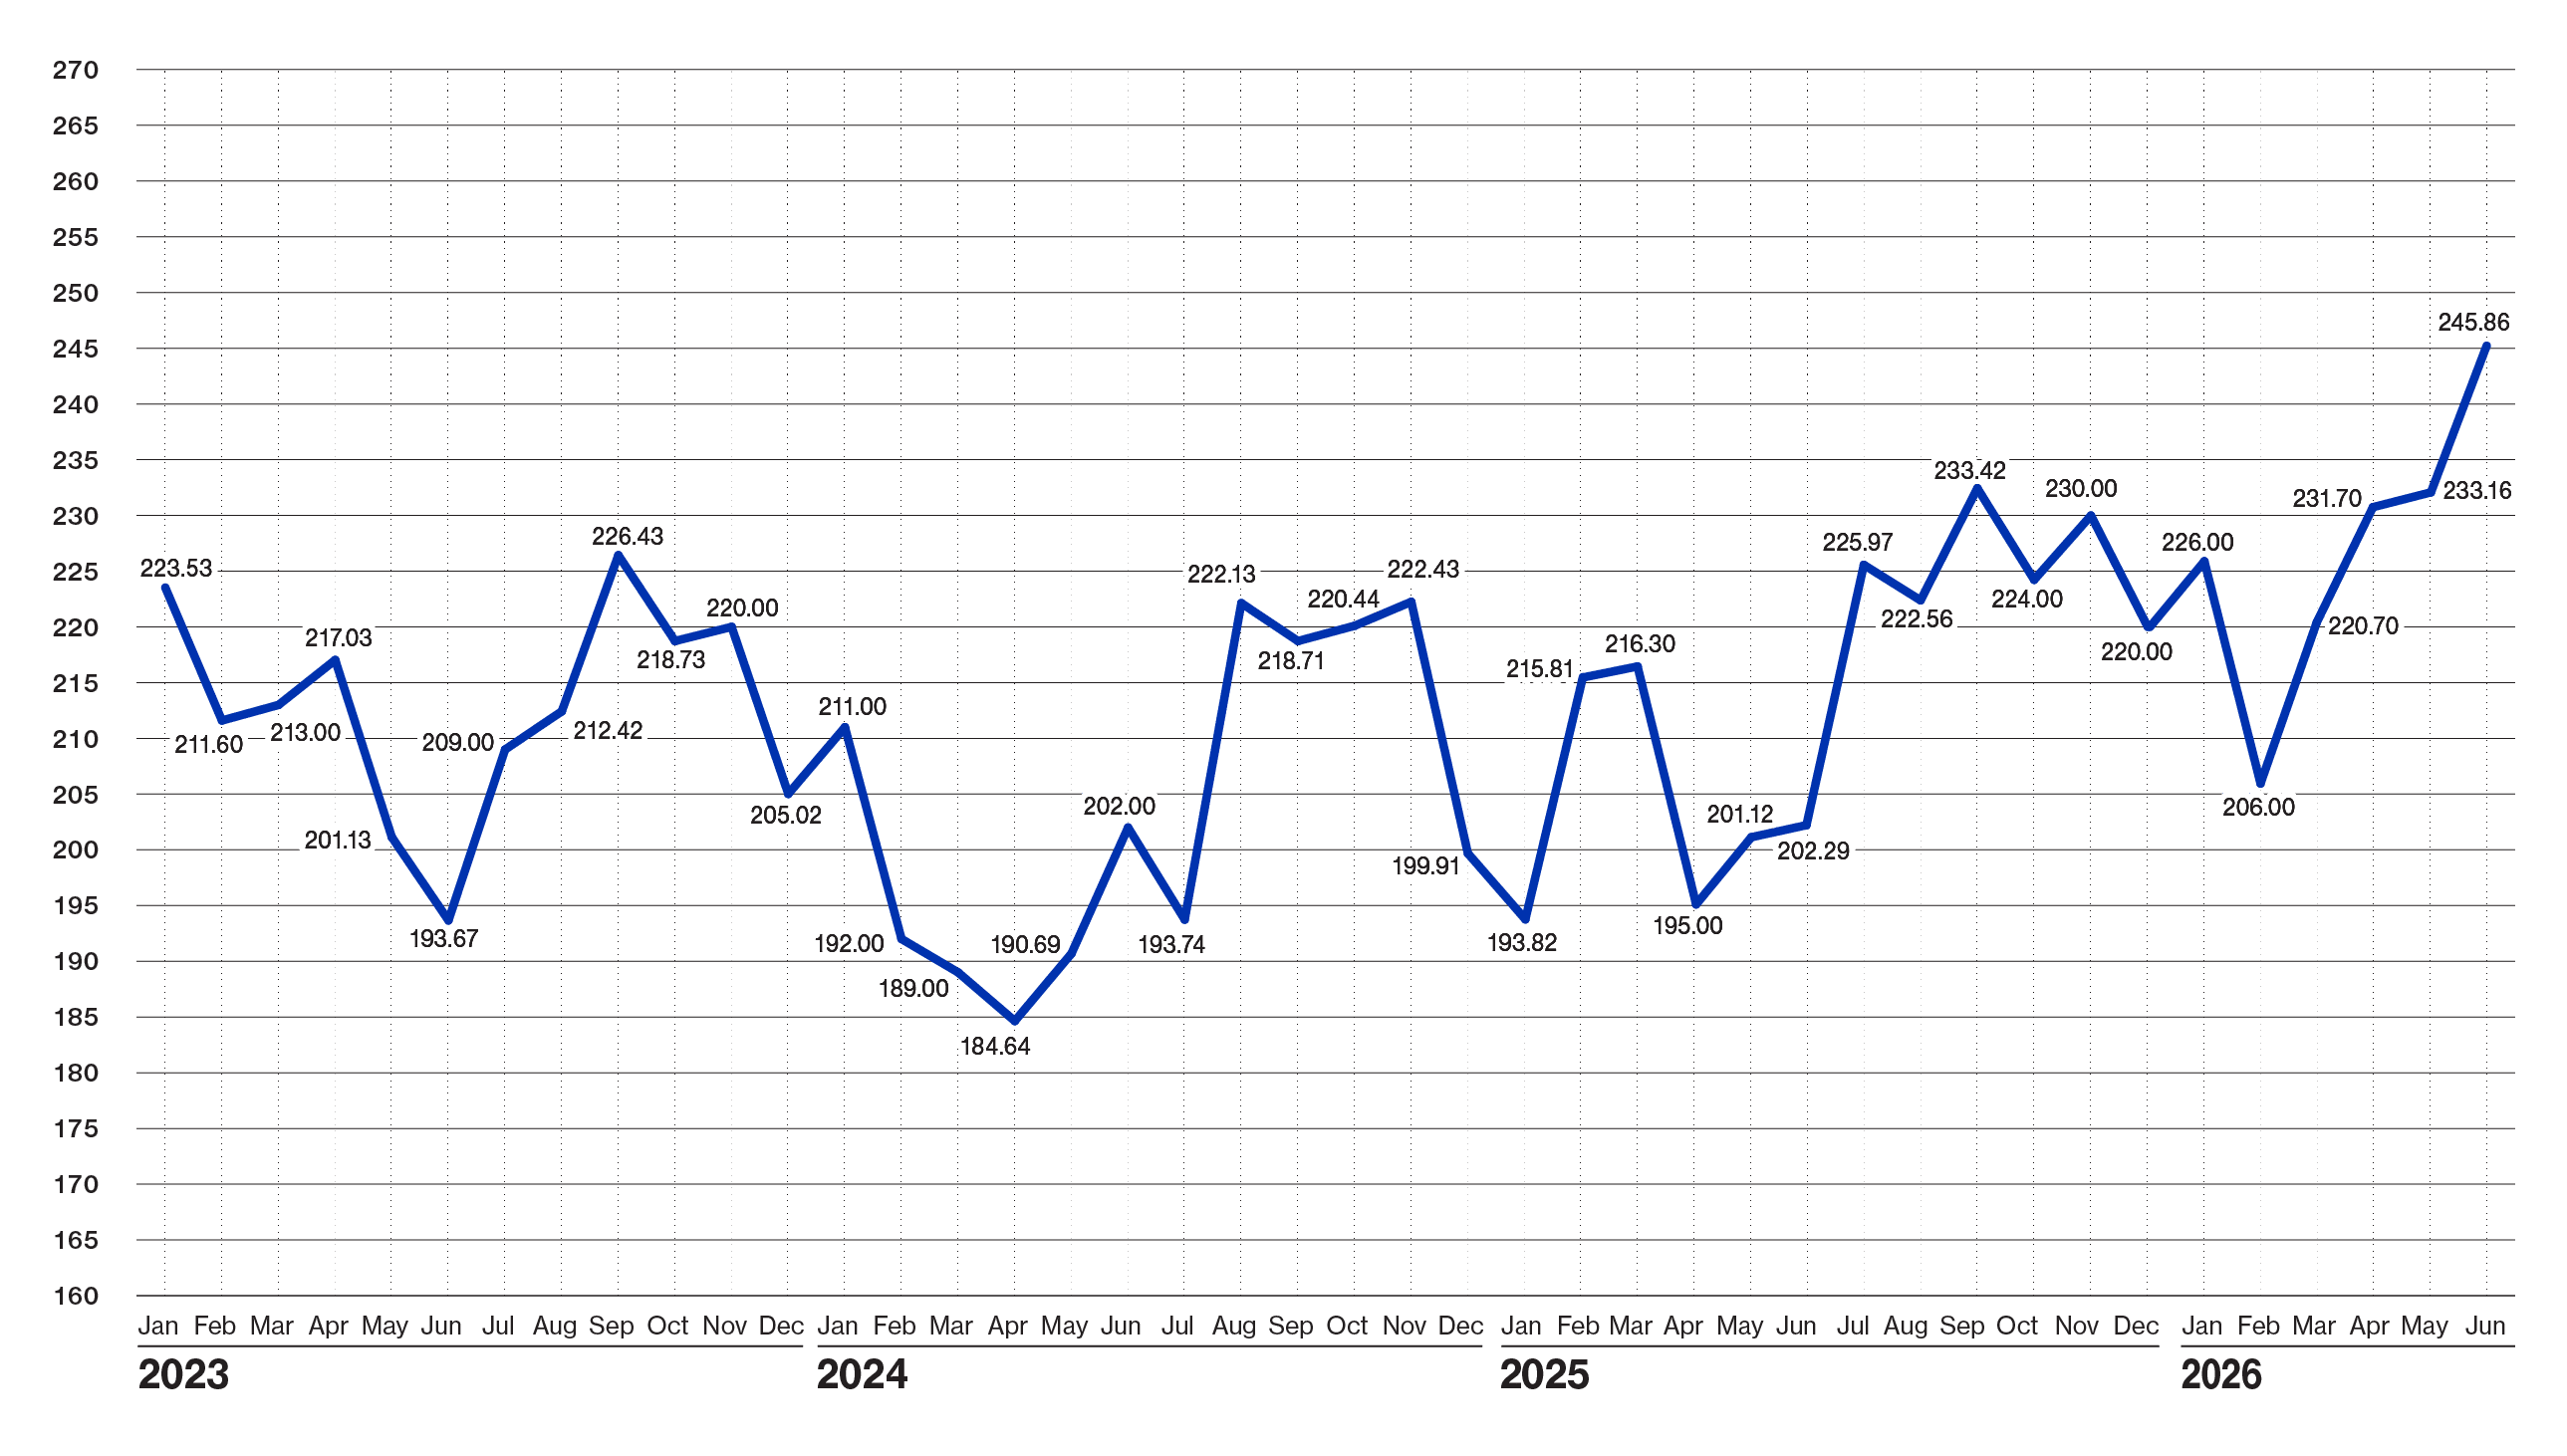
| Economic Components | Current Month | Last Month | Last Year |
|---|---|---|---|
| Index (Base Jan. 88 @ 100) | 245.86 | 233.16 | 201.12 |
| Sales Tax Collections | $ 10,020,371 | $ 11,198,931 | $ 8,482,019 |
| Sales Tax Collection-YTD | $ 58,806,973 | $ 48,786,602 | $ 52,771,450 |
| New Vehicle Sales | 776 | 701 | 812 |
| Used Vehicle Sales | 1,813 | 1,545 | 1,836 |
| Airline Boardings | 37,561 | 33,299 | 38,516 |
| Hotel/Motel Receipt Tax | $ 972,738 | $ 1,018,264 | $ 762,291 |
| Population - Corporate Amarillo | 201,106 | 201,106 | 201,106 |
| Employment - CLF | 140,039 | 139,623 | 139,558 |
| Unemployment Rate | % 3.50 | % 3.20 | % 3.00 |
| Total Workers Employed (Household Survey) | 135,187 | 135,130 | 135,383 |
| Total Workers Employed (Employers Survey) | 131,500 | 130,711 | 131,763 |
| Average Weekly Wages | $ 1,203.00 | $ 1,102.00 | $ 1,071.00 |
| Gas Meters | 70,022 | 70,098 | 70,104 |
| Interest Rates: 30 Year Mortgage Rates | % 6.375 | % 6.625 | % 6.875 |
| Building Permits Dollar Amount | $ 59,086,663 | $ 53,936,791 | $ 27,087,762 |
| Year to Date Permits | $ 251,592,602 | $ 193,568,781 | $ 170,451,029 |
| Residential Starts | 68 | 53 | 35 |
| Year To Date Starts | 267 | 198 | 164 |
| Median House Sold Price | $ 265,000 | $ 269,000 | $ 253,810 |
| Drilling Rigs In Panhandle | 3 | 3 | 0 |
| Oil Price Per Barrel | $ 80.54 | $ 102.62 | $ 75.30 |
| Natural Gas | $ 3.11 | $ 2.88 | $ 3.99 |
| Wheat Per Bushel | $ 5.83 | $ 6.74 | $ 6.31 |
| Fed Cattle Per CWT | $ 257.00 | $ 260.00 | $ 225.00 |
| Corn Per Bushel | $ 4.66 | $ 4.90 | $ 4.37 |
| Cotton (Cents Per Pound) | $ 69.00 | $ 83.00 | $ 63.50 |
| Milk | $ 15.98 | $ 17.43 | $ 18.68 |
Prepare for the majestic dance of disclaimers!
This document was prepared by Amarillo National Bank on behalf of itself for distribution in Amarillo, Texas and is provided for informational purposes only. The information, opinions, estimates and forecasts contained herein relate to specific dates and are subject to change without notice due to market and other fluctuations. The information, opinions, estimates and forecasts contained in this document have been gathered or obtained from public sources believed to be accurate, complete and/or correct. The information and observations contained herein are solely statements of opinion and not statements of fact or recommendations to purchase, sell or make any other investment decisions.
Economic Pulse Charts
{beginAccordion h3}
2026 Economic Analysis
{endAccordion}
{beginAccordion h3}
2025 Economic Analysis
{endAccordion}
{beginAccordion h3}
2024 Economic Analysis
{endAccordion}
{beginAccordion h3}
2023 Economic Analysis
{endAccordion}