January 2026
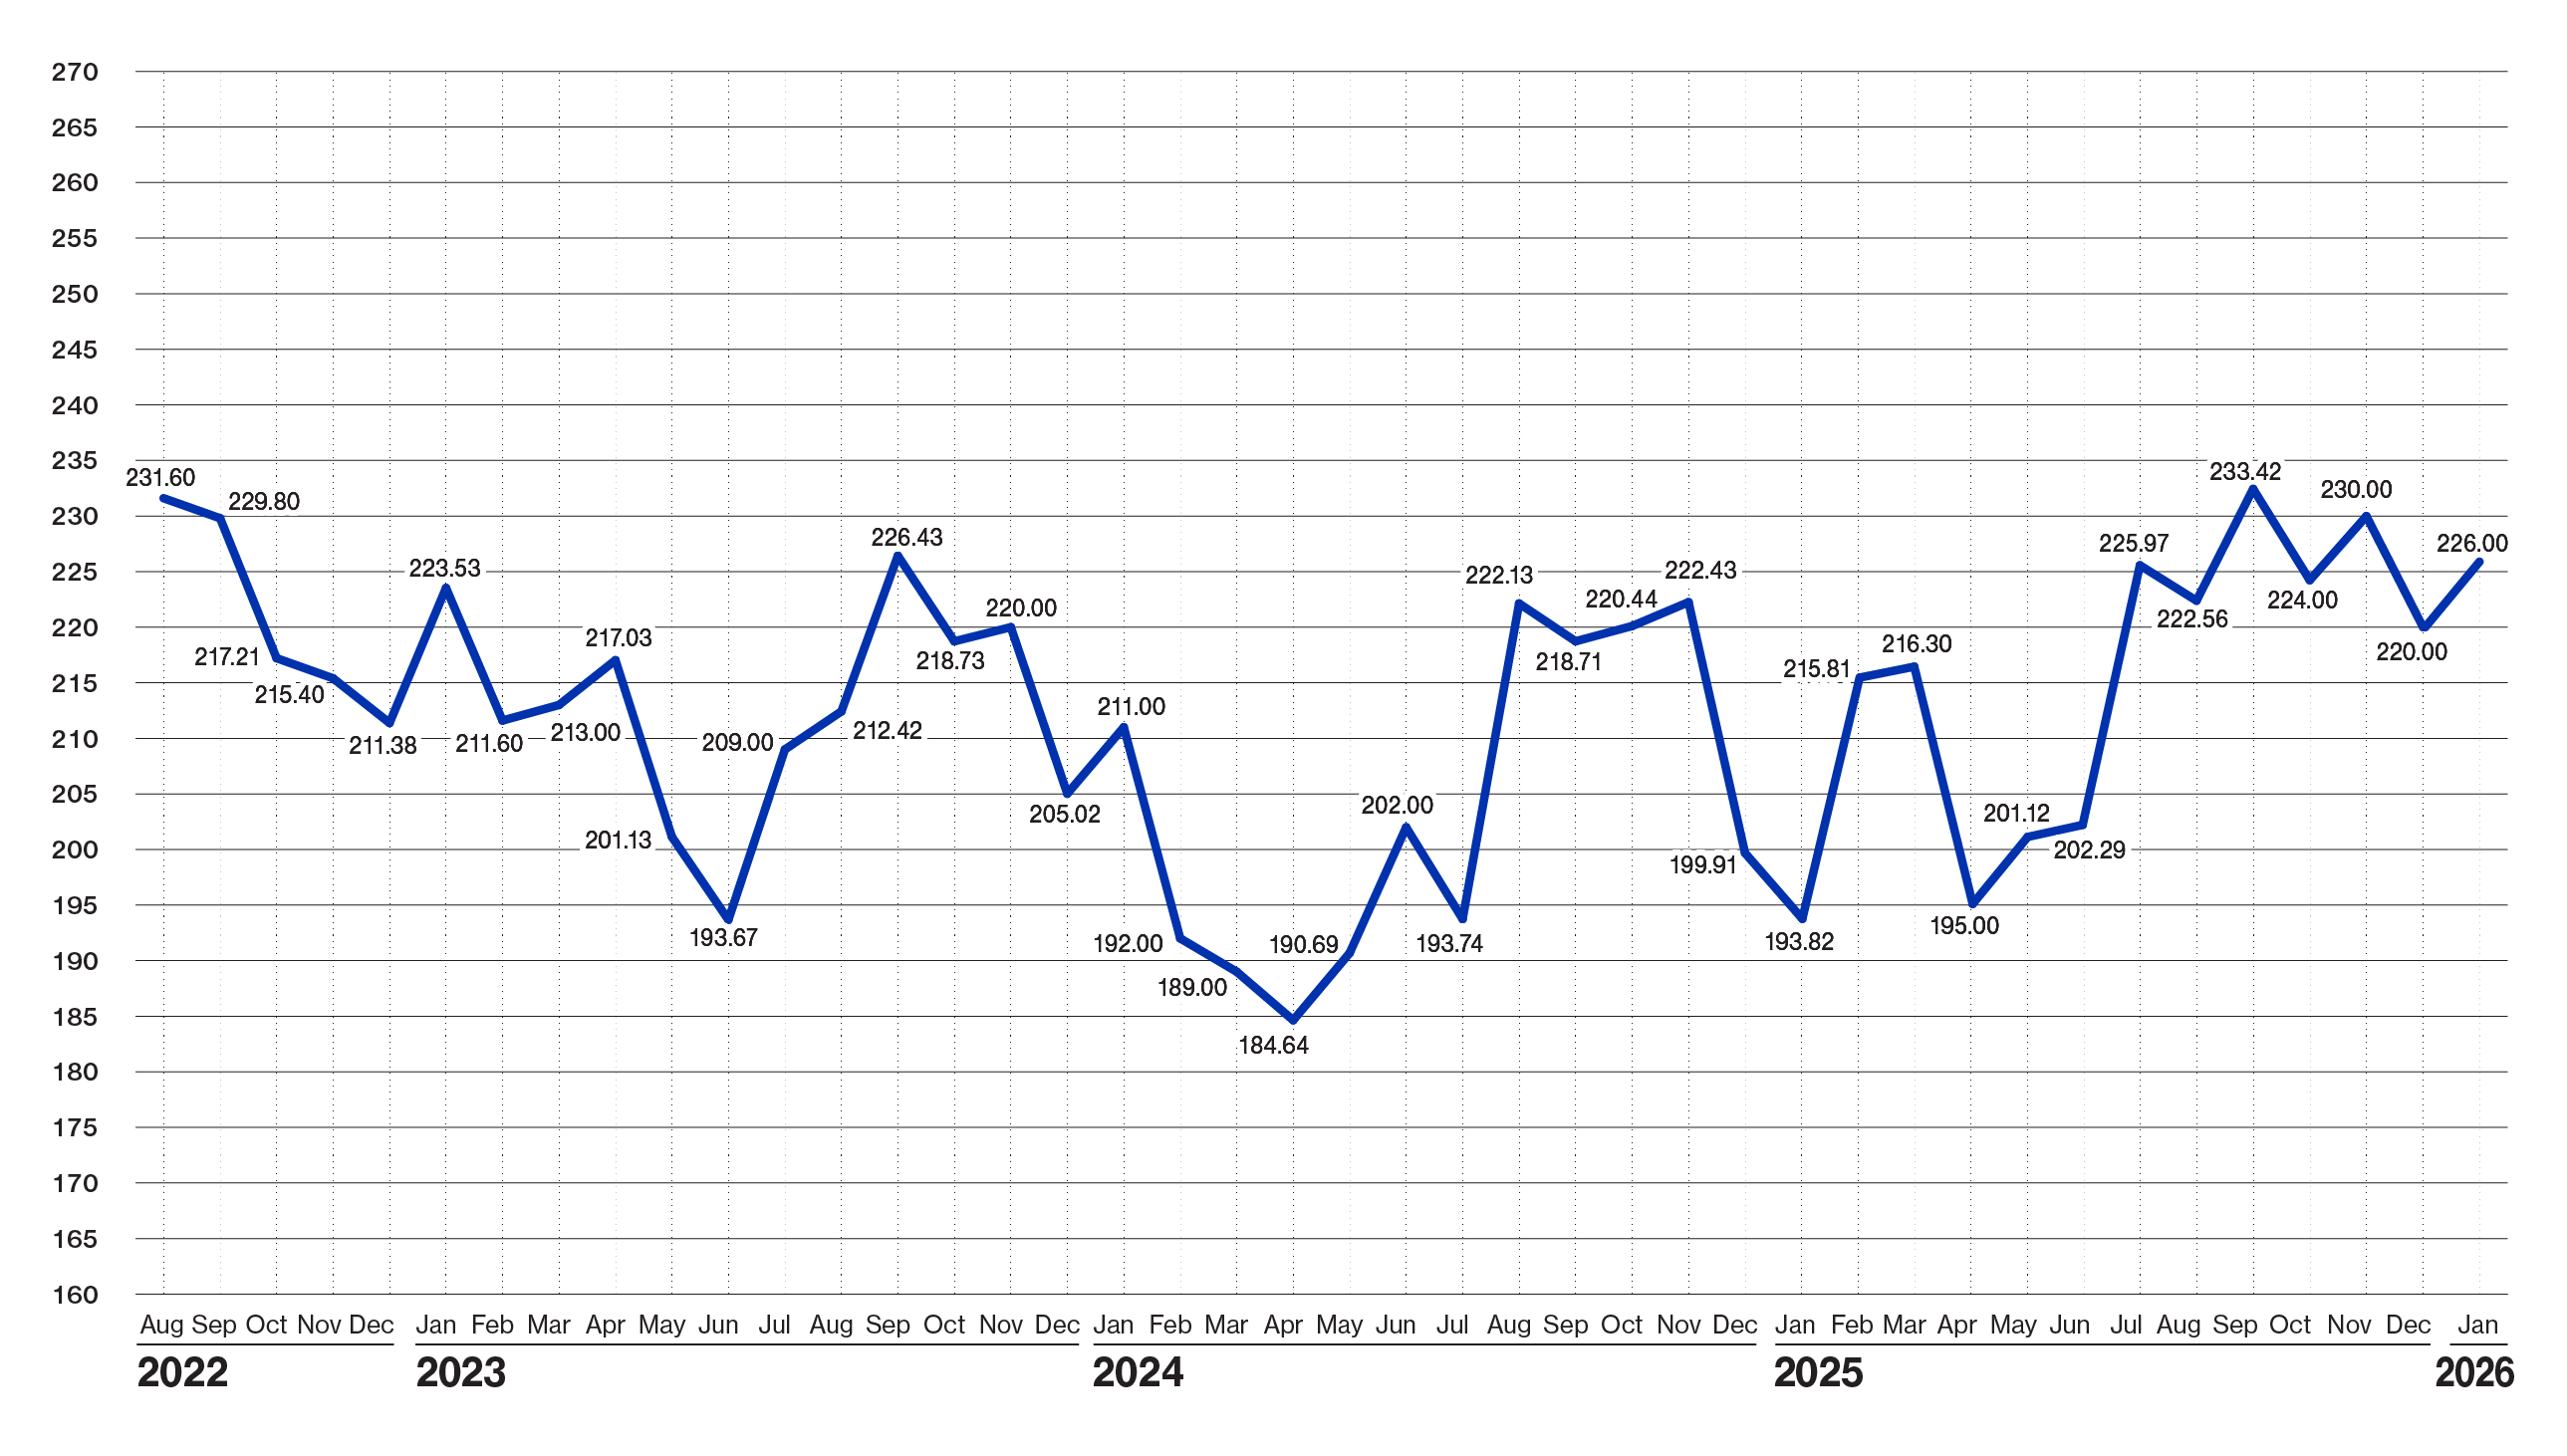
Amarillo's economy starts the year off strong with higher retail sales, more cars sold and diverse construction projects.
The jobs numbers are still coming in slow due to the Government Shutdown last Fall. We think the job numbers should be good for our area during the 1st quarter to 2026, as data center construction offsets the Tyson layoffs (Claude and Fermi are in the Amarillo job numbers).
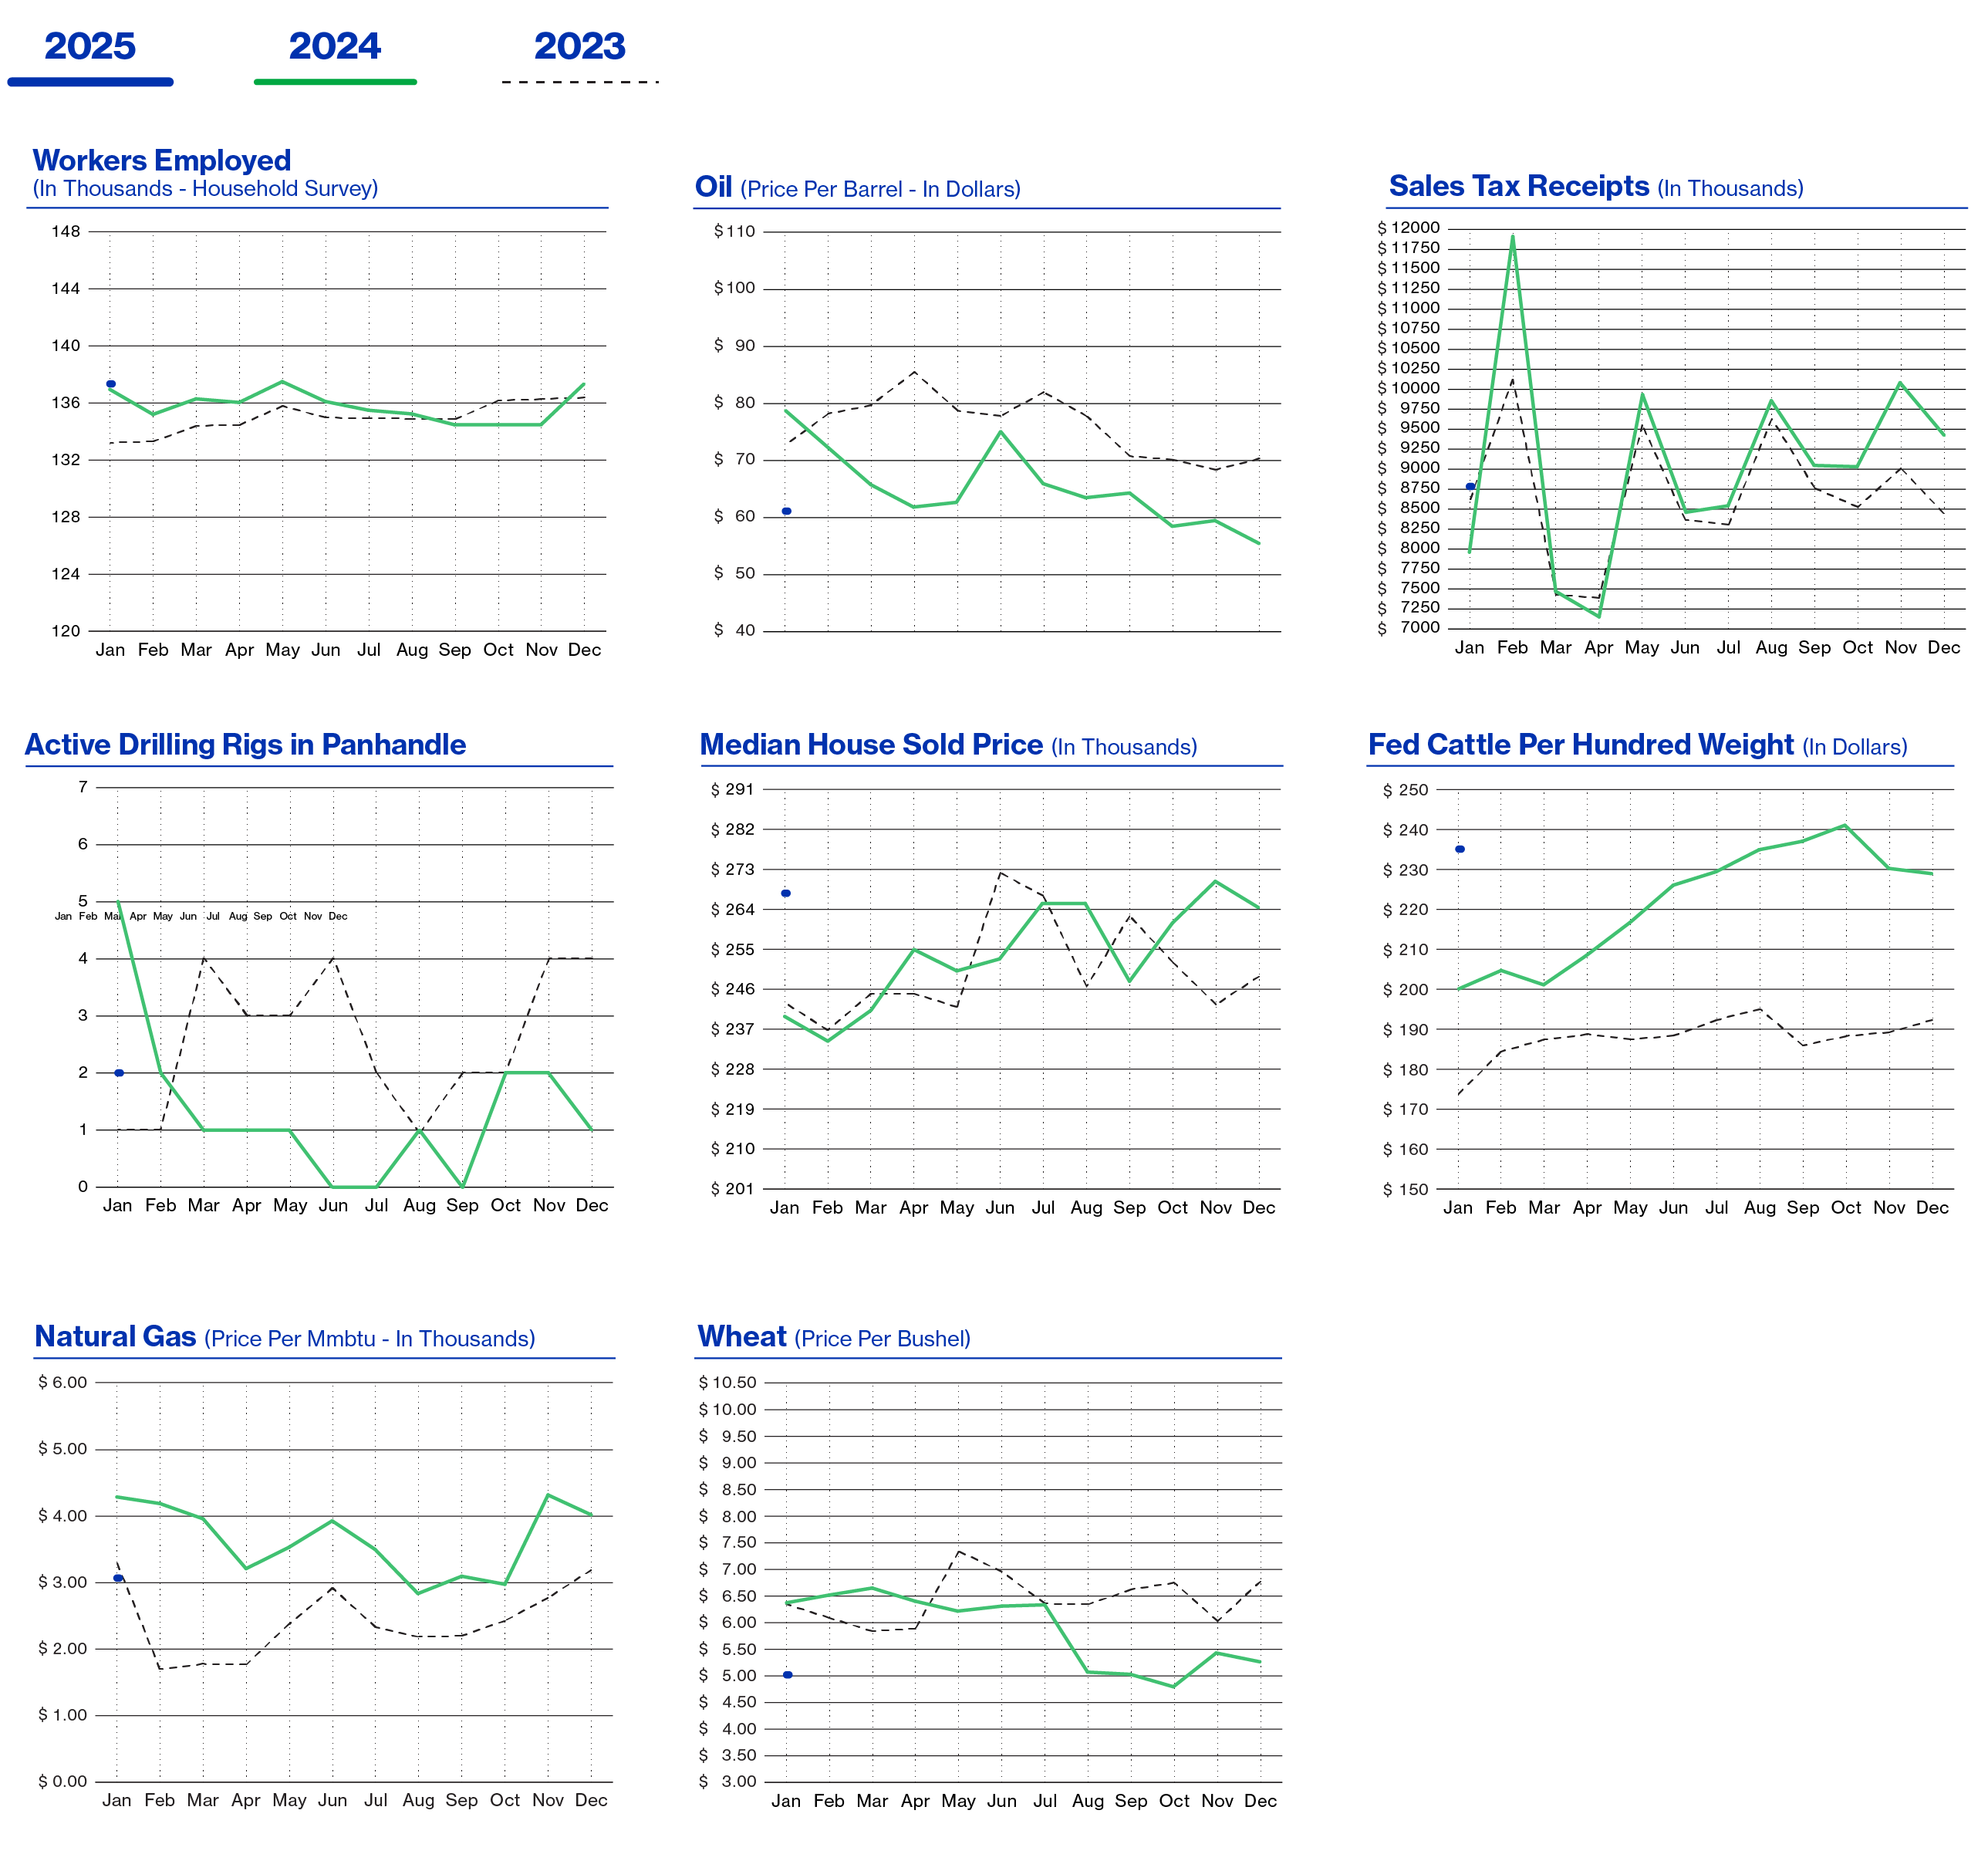
Retail Sales were up 11% from 12 months ago. Year to Date Sales-through November- are up 4%. New Car Sales are up 17% and Used Car Sales are up 27%.
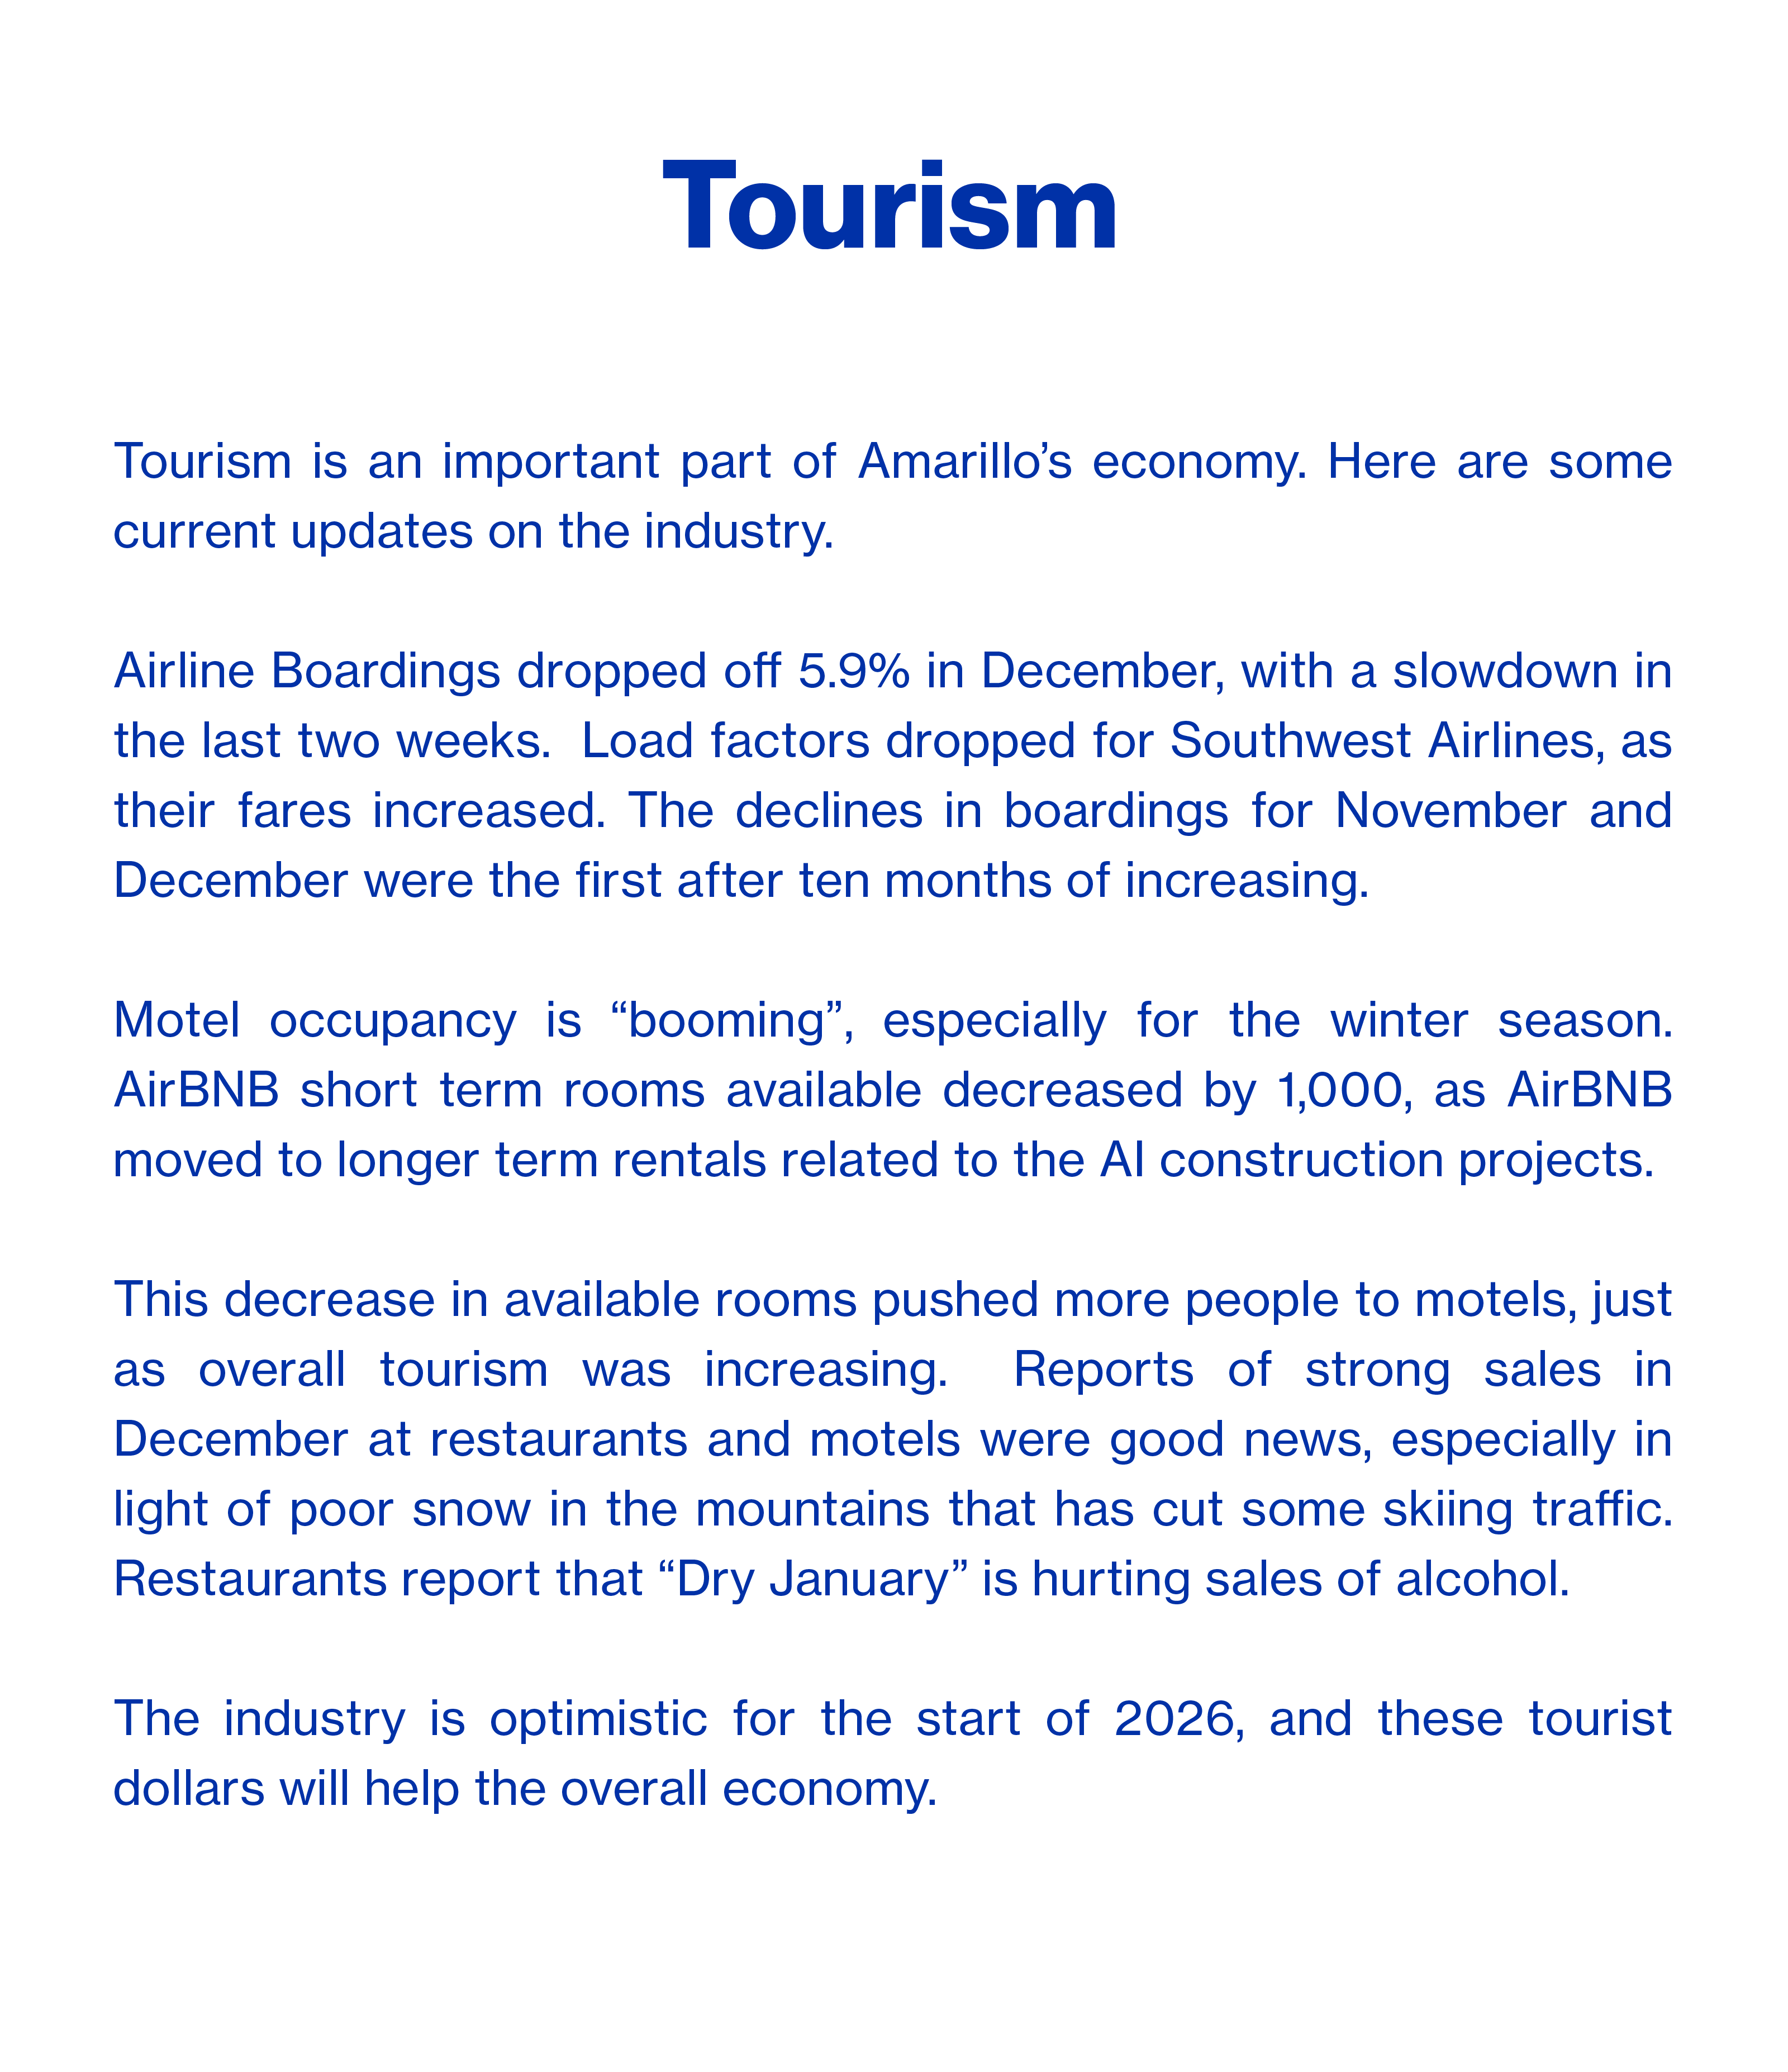
Airline Boardings are down, but Hotel/Motel Tax Collections are up 24% (see attached white paper).
Mortgage Rates are down under 6%, but it hasn't moved sales activity by much. House Prices are up 10%. Our bank will be tracking President Trump's effort to move mortgage rates down by having Freddie Mac and Fannie Mae purchase mortgage bonds.
Building permits are up 10%. Data Center activity continues to draw workers, materials, and trucking to these giant projects. Residential Starts up flat with a year ago.
Cotton prices are down 16%. Corn Prices are down 9%. Wheat prices are down 17%. As we often say, we need moisture and we need it soon. Dairies are breaking even at $15 milk, down 20% from a year ago. Feedyards are profitable and cattle prices are up 14%.
Oil prices are down 28% due to news from Venezuela and Iran. It feels like imports don't impact prices like they used to. Natural Gas prices are down 25%, but a cold snap could make them rise this winter.
Economic Pulse

| Economic Components | Current Month | Last Month | Last Year |
|---|---|---|---|
| Index (Base Jan. 88 @ 100) | 226.00 | 220.00 | 193.82 |
| Sales Tax Collections | $ 8,763,473 | $ 9,393,313 | $ 7,913,301 |
| Sales Tax Collection-YTD | $ 117,406,759 | $ 108,643,286 | $ 111,991,545 |
| New Vehicle Sales | 751 | 725 | 617 |
| Used Vehicle Sales | 1,305 | 1,478 | 1,164 |
| Airline Boardings | 32,856 | 32,620 | 35,850 |
| Hotel/Motel Receipt Tax | $ 817,209 | $ 857,197 | $ 692,195 |
| Population - Corporate Amarillo | 201,106 | 201,106 | 201,106 |
| Employment - CLF | 142,266 | 141,318 | |
| Unemployment Rate | % | % | % 2.60 |
| Total Workers Employed (Household Survey) | 137,790 | 137,638 | |
| Total Workers Employed (Employers Survey) | 132,400 | 132,000 | |
| Average Weekly Wages | $ 1,071.00 | $ 1,071.00 | $ 1,052.00 |
| Gas Meters | 70,003 | 69,337 | 69,866 |
| Interest Rates: 30 Year Mortgage Rates | % 5.880 | % 6.000 | % 7.000 |
| Building Permits Dollar Amount | $ 37,658,444 | $ 33,380,965 | $ 16,412,147 |
| Year to Date Permits | $ 735,906,397 | $ 699,300,133 | $ 474,452,439 |
| Residential Starts | 43 | 71 | 43 |
| Year To Date Starts | 512 | 474 | 543 |
| Median House Sold Price | $ 267,000 | $ 264,640 | $ 240,000 |
| Drilling Rigs In Panhandle | 2 | 1 | 5 |
| Oil Price Per Barrel | $ 61.66 | $ 56.75 | $ 78.89 |
| Natural Gas | $ 3.09 | $ 4.03 | $ 4.31 |
| Wheat Per Bushel | $ 5.03 | $ 5.30 | $ 6.39 |
| Fed Cattle Per CWT | $ 235.50 | $ 229.00 | $ 200.00 |
| Corn Per Bushel | $ 4.20 | $ 4.37 | $ 4.79 |
| Cotton (Cents Per Pound) | $ 54.43 | $ 54.63 | $ 65.60 |
| Milk | $ 14.92 | $ 16.00 | $ 20.05 |
Prepare for the majestic dance of disclaimers!
This document was prepared by Amarillo National Bank on behalf of itself for distribution in Amarillo, Texas and is provided for informational purposes only. The information, opinions, estimates and forecasts contained herein relate to specific dates and are subject to change without notice due to market and other fluctuations. The information, opinions, estimates and forecasts contained in this document have been gathered or obtained from public sources believed to be accurate, complete and/or correct. The information and observations contained herein are solely statements of opinion and not statements of fact or recommendations to purchase, sell or make any other investment decisions.
Economic Pulse Charts


{beginAccordion h3}
2026 Economic Analysis
{endAccordion}
{beginAccordion h3}
2025 Economic Analysis
{endAccordion}
{beginAccordion h3}
2024 Economic Analysis
{endAccordion}
{beginAccordion h3}
2023 Economic Analysis
{endAccordion}

