


October 2026
Amarillo's economy leveled out in October with flattening retail sales and construction brought down by less jobs and lower commodity prices.
Delivery costs due to higher diesel prices adds about ½% to most retail item prices. The higher inflation is slowing all spending-retail, commercial and construction.
Retail Sales were up 14% from both a year ago and YTD. Both New and Used Car Sales are even with 12 months ago. Our bank is noticing that mid-tier credit scores have been staying out of car buying since the beginning of Summer. We will watch how this important and majority spending group spends over the rest of the year.
Amarillo Airport September
| Passengers | Flights | |
| Southwest | 15,800 +2% | 156 |
| American | 14,652 +13% | 241 |
| United | 5,319 -7% | 131 |
American added one flight per day over last year's schedule.
The Household Survey shows a decrease of 1,139 jobs since last October. The Employers Survey shows a decrease of 392 jobs over the same period. Wages are up 12% from a year ago.
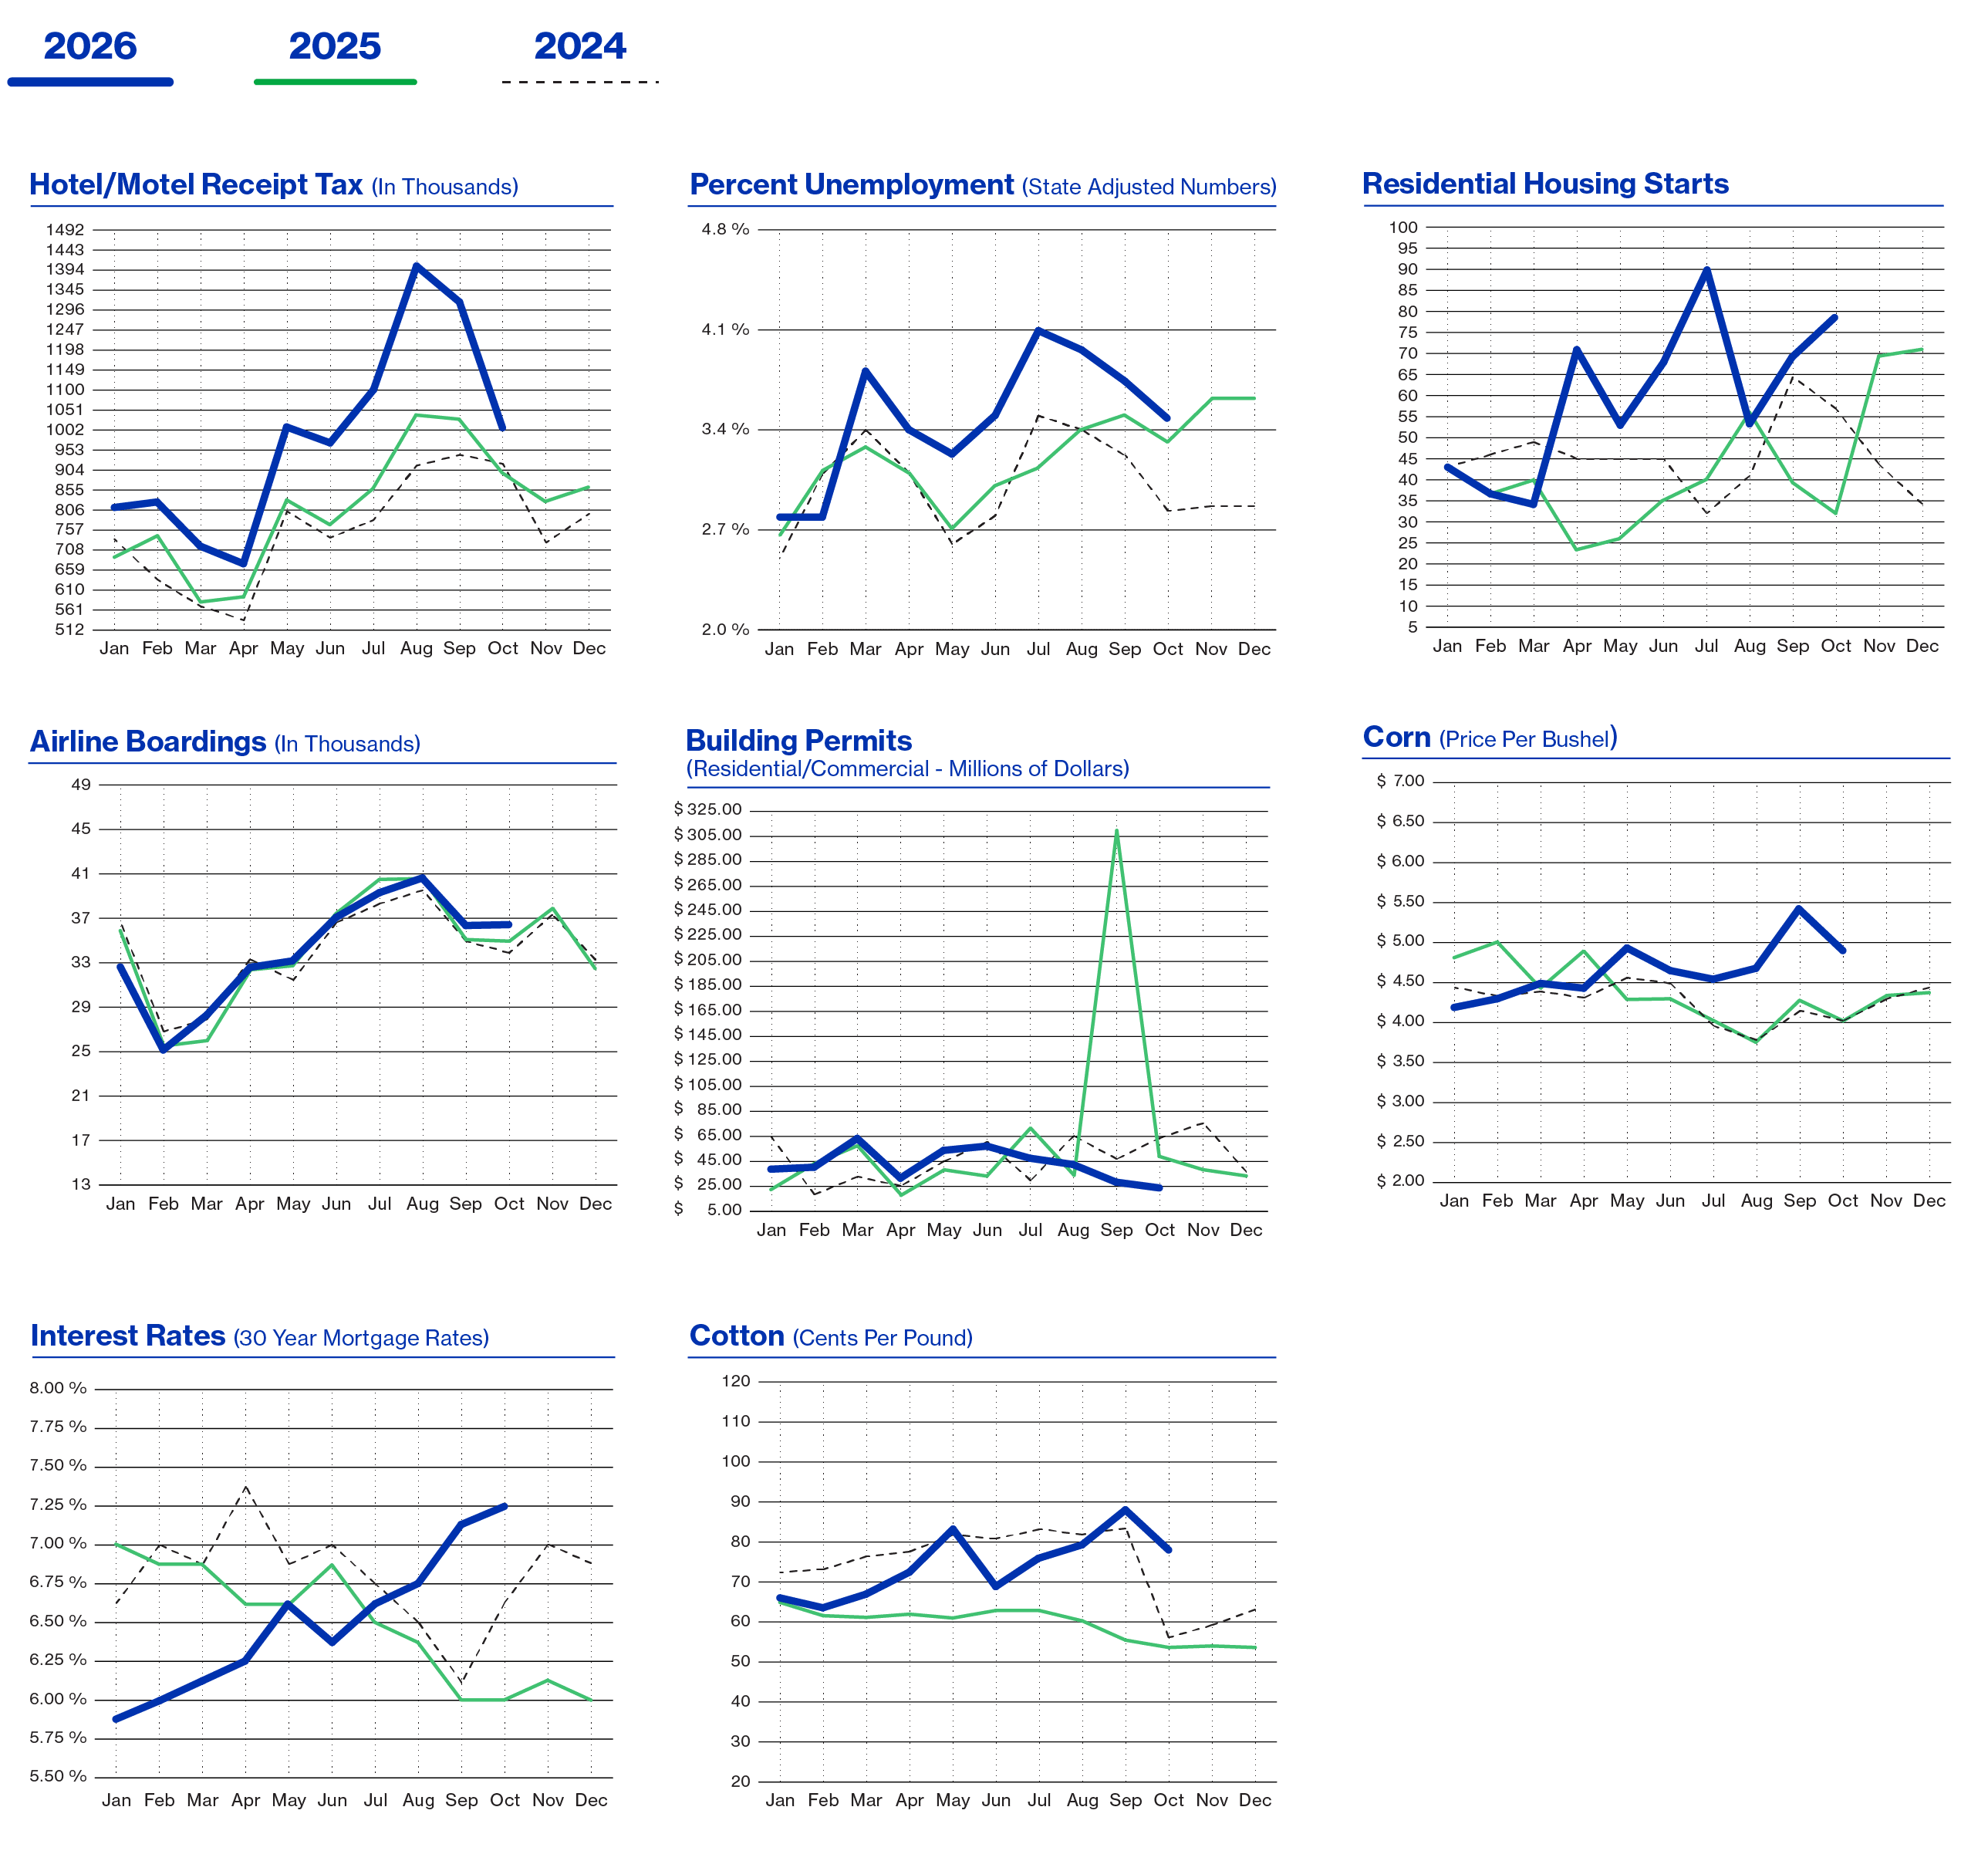
Mortgage Rates are moving in every direction with the 10 Year Treasury changes. Rates remain higher than 7% compared to 6% last October.
Housing Starts are twice as much as 12 months ago and Year to Date Starts are up 67% from 2025. Commercial Construction is half of last year when all the Data Center projects began. Of the 5 major announced data center sites in our surrounding counties, 4 of them are off to amazing starts with startling progress. The Data Center Economic phenomenon is changing our local economy at an amazing clip.
We have 4 drilling rigs in the Panhandle, up from 2 last year. Oil Prices are below $100 and up 63% from last year. Natural Gas Prices are up 7% from 12 months ago and over $3, a good level for Panhandle producers.
The rains over the last month will help next year's wheat crop. Wheat prices are up 35%. Corn had a decent year and prices are at $4.81, up 20% from a year ago. Milk prices are at $15, down 11% from a year ago.
Dairies however remain profitable for now due to lower input costs. Milk Prices at the grocery store will go up because of the already mentioned Diesel problems. Cattle remain highly priced but are down 8% from last year. Feedyards should make around $60 per head, down from $200 last year.
Economic Pulse
| Economic Components | Current Month | Last Month | Last Year |
|---|---|---|---|
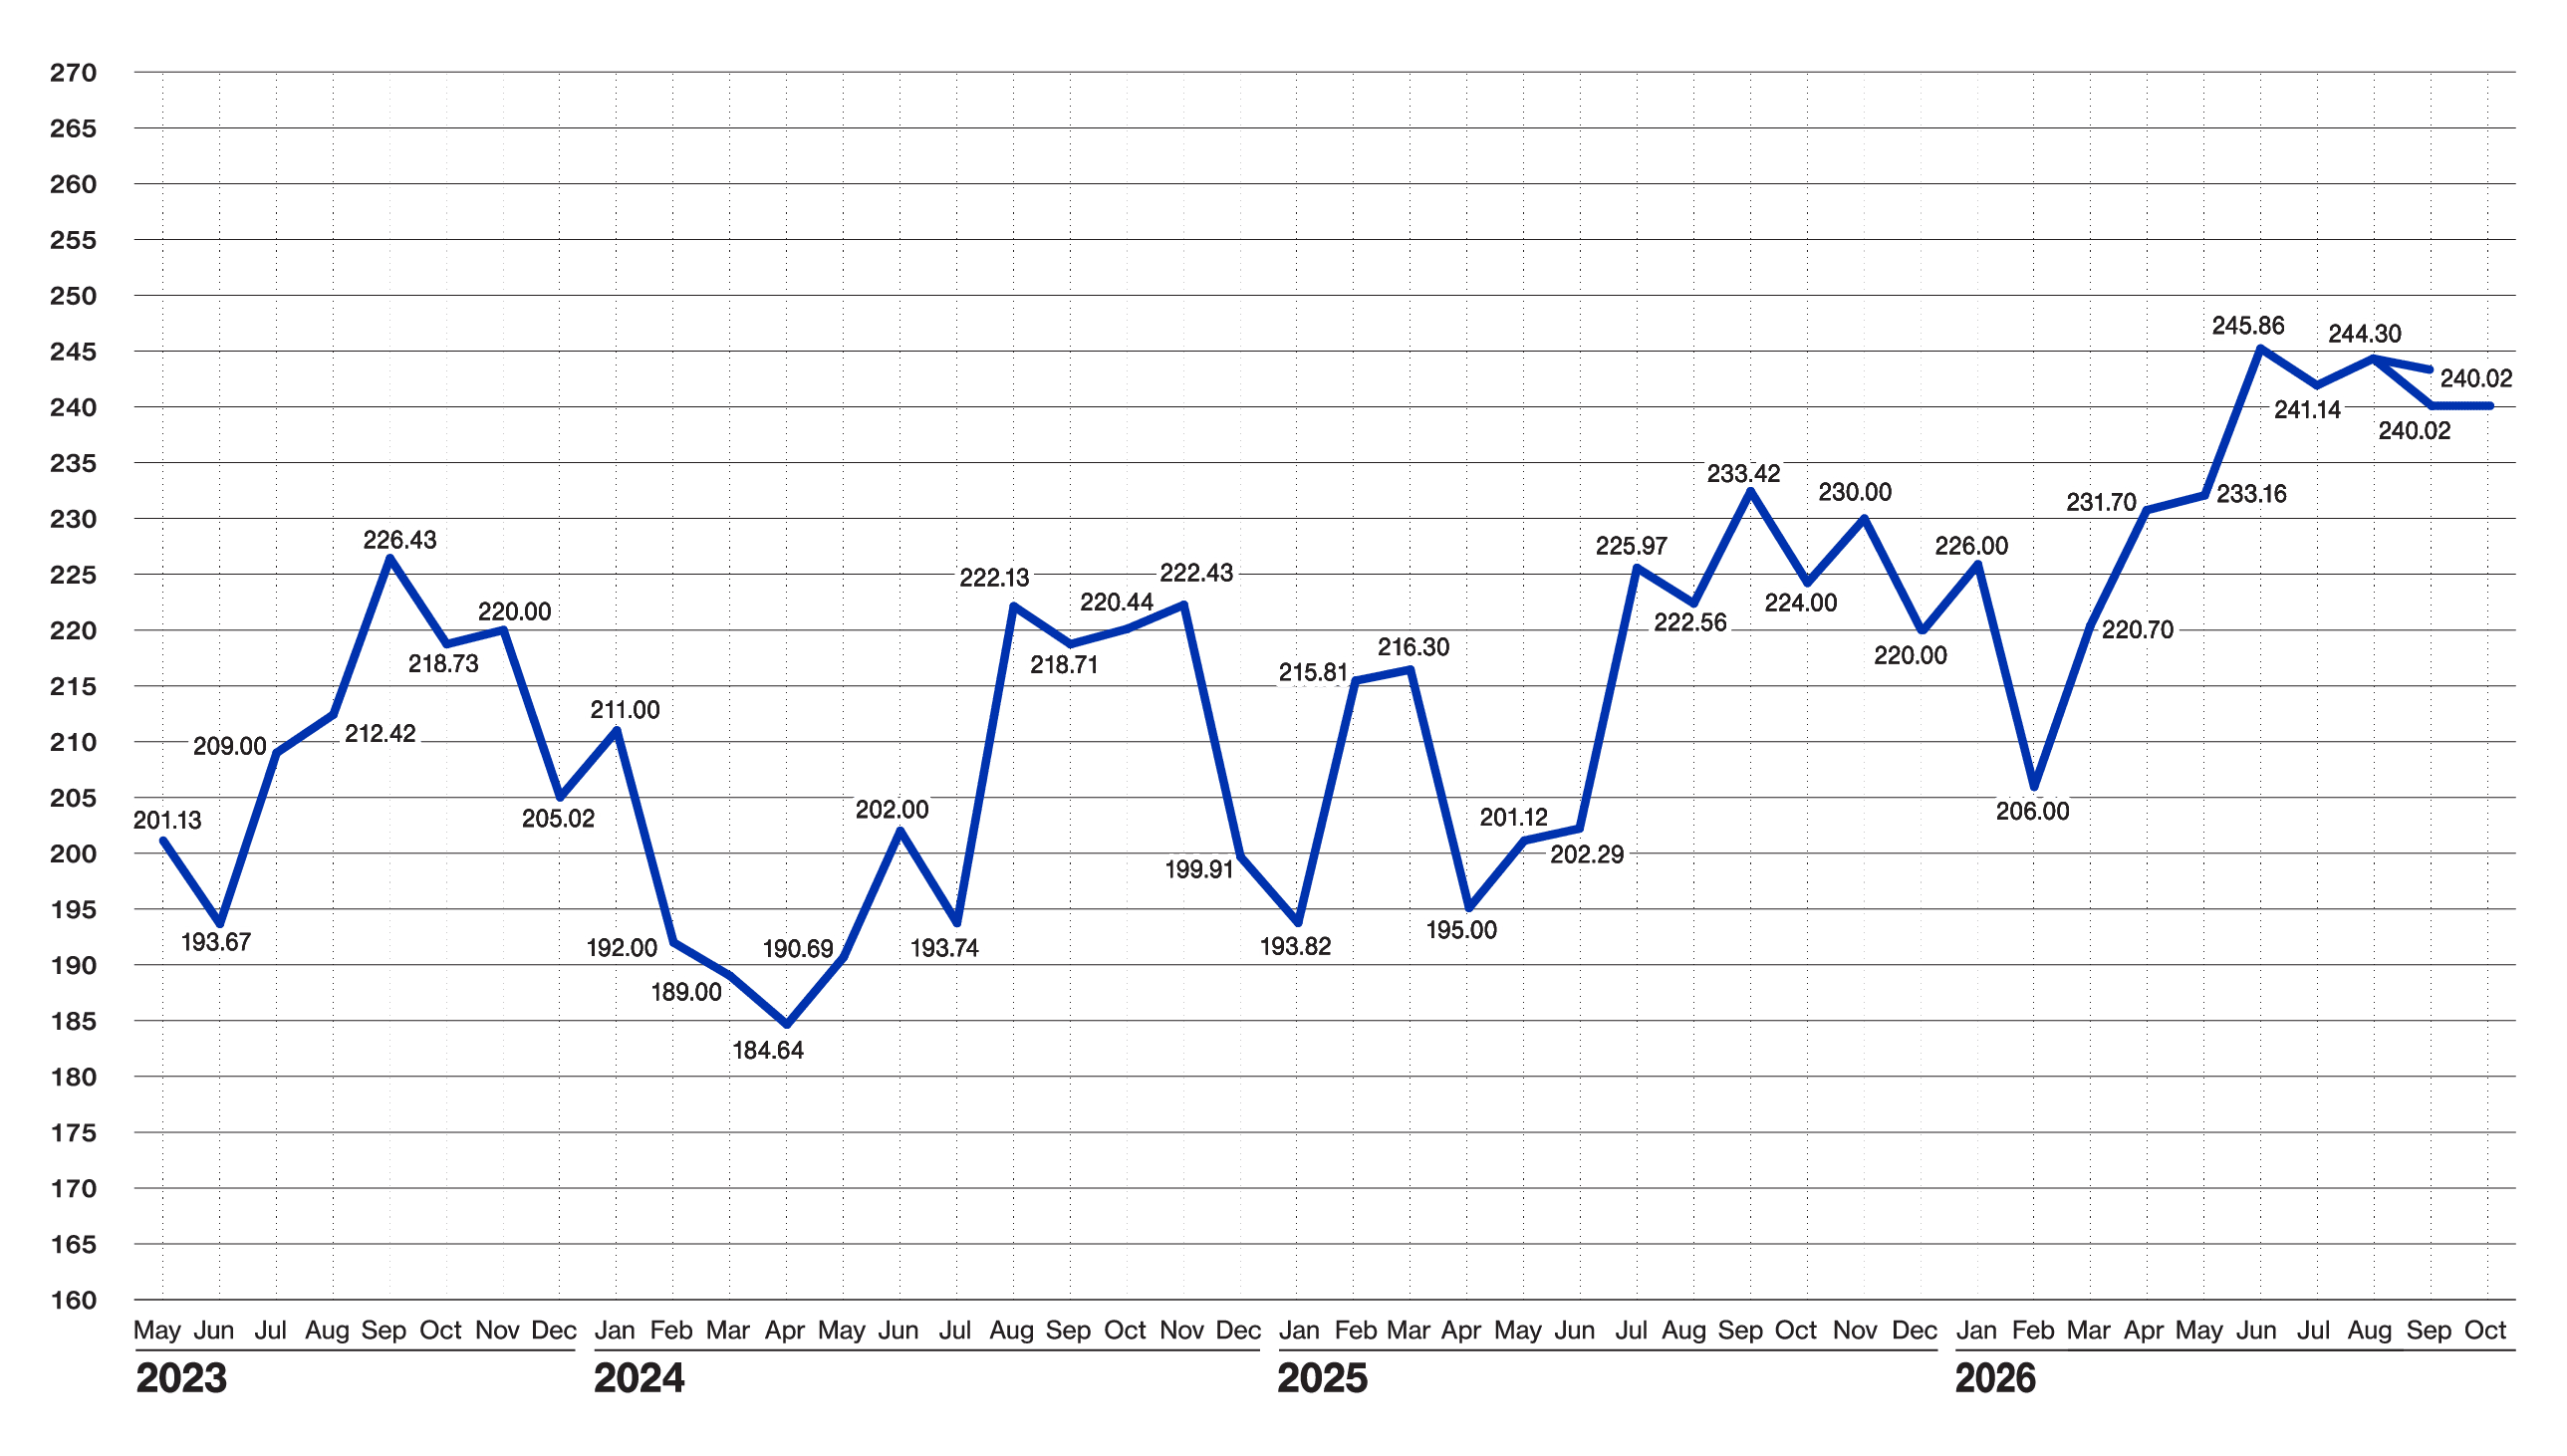
| Index (Base Jan. 88 @ 100) | 240.02 | 240.02 | 224.00 |
| Sales Tax Collections | $ 10,273,088 | $ 10,638,741 | $ 9,014,275 |
| Sales Tax Collection-YTD | $ 101,241,547 | $ 90,968,459 | $ 89,140,801 |
| New Vehicle Sales | 796 | 795 | 791 |
| Used Vehicle Sales | 1,512 | 1,553 | 1,529 |
| Airline Boardings | 36,606 | 36,352 | 35,031 |
| Hotel/Motel Receipt Tax | $ 1,012,775 | $ 1,320,800 | $ 901,303 |
| Population - Corporate Amarillo | 201,106 | 201,106 | 201,106 |
| Employment - CLF | 140,465 | 139,770 | 141,327 |
| Unemployment Rate | % 3.50 | % 3.70 | % 3.30 |
| Total Workers Employed (Household Survey) | 135,565 | 134,564 | 136,704 |
| Total Workers Employed (Employers Survey) | 130,700 | 130,438 | 131,092 |
| Average Weekly Wages | $ 1,203.00 | $ 1,203.00 | $ 1,071.00 |
| Gas Meters | 69,732 | 69,815 | 69,339 |
| Interest Rates: 30 Year Mortgage Rates | % 7.250 | % 7.125 | % 6.000 |
| Building Permits Dollar Amount | $ 24,278,533 | $ 28,319,244 | $ 48,222,561 |
| Year to Date Permits | $ 394,356,508 | $ 370,077,975 | $ 626,026,553 |
| Residential Starts | 78 | 69 | 32 |
| Year To Date Starts | 554 | 497 | 332 |
| Median House Sold Price | $ 265,000 | $ 270,000 | $ 260,000 |
| Drilling Rigs In Panhandle | 4 | 5 | 2 |
| Oil Price Per Barrel | $ 94.86 | $ 104.71 | $ 58.41 |
| Natural Gas | $ 3.20 | $ 2.93 | $ 2.99 |
| Wheat Per Bushel | $ 6.49 | $ 6.62 | $ 4.81 |
| Fed Cattle Per CWT | $ 220.50 | $ 223.45 | $ 241.00 |
| Corn Per Bushel | $ 4.81 | $ 5.41 | $ 4.01 |
| Cotton (Cents Per Pound) | $ 78.00 | $ 88.00 | $ 54.15 |
| Milk | $ 15.05 | $ 16.25 | $ 17.00 |
Prepare for the majestic dance of disclaimers!
This document was prepared by Amarillo National Bank on behalf of itself for distribution in Amarillo, Texas and is provided for informational purposes only. The information, opinions, estimates and forecasts contained herein relate to specific dates and are subject to change without notice due to market and other fluctuations. The information, opinions, estimates and forecasts contained in this document have been gathered or obtained from public sources believed to be accurate, complete and/or correct. The information and observations contained herein are solely statements of opinion and not statements of fact or recommendations to purchase, sell or make any other investment decisions.
Economic Pulse Charts
{beginAccordion h3}
2026 Economic Analysis
{endAccordion}
{beginAccordion h3}
2025 Economic Analysis
{endAccordion}
{beginAccordion h3}
2024 Economic Analysis
{endAccordion}
{beginAccordion h3}
2023 Economic Analysis
{endAccordion}